
Class 9 Science: How to Read Distance-Time and Velocity-Time Graphs
Understanding motion graphs is essential for mastering concepts in Class 9 Science and excelling in CBSE exams.
Students often struggle with interpreting distance-time and velocity-time graphs, leading to confusion in exams. This blog introduces the concept of Motion Graph Literacy, which simplifies the reading of these graphs. Readers will learn how to analyze graphs effectively, common pitfalls to avoid, and practical exercises to enhance their understanding.

Hari krishna
@harikrishna2
Listen to this article
Class 9 Science: How to Read Distance-Time and Velocity-Time Graphs
Learning Objectives and Prerequisites
Before diving into the intricacies of distance-time and velocity-time graphs, it's crucial to establish a solid foundation. Students in Class 9 are expected to have a basic understanding of motion, speed, and velocity as outlined in the NCERT Science textbook, specifically in Chapter 8: Motion. Familiarity with the concepts of distance and displacement will also aid in grasping the graphical representations of these terms.
The learning objectives for this blog include:
- Understanding the key components of distance-time and velocity-time graphs.
- Developing skills to interpret and analyze these graphs accurately.
- Identifying common mistakes students make while reading motion graphs.
- Practicing with real-life examples to reinforce learning.
By the end of this blog, students will be equipped to approach motion graphs with confidence, enhancing their performance in CBSE examinations.
Core Concepts Behind How to Read Distance-Time and Velocity-Time Graphs
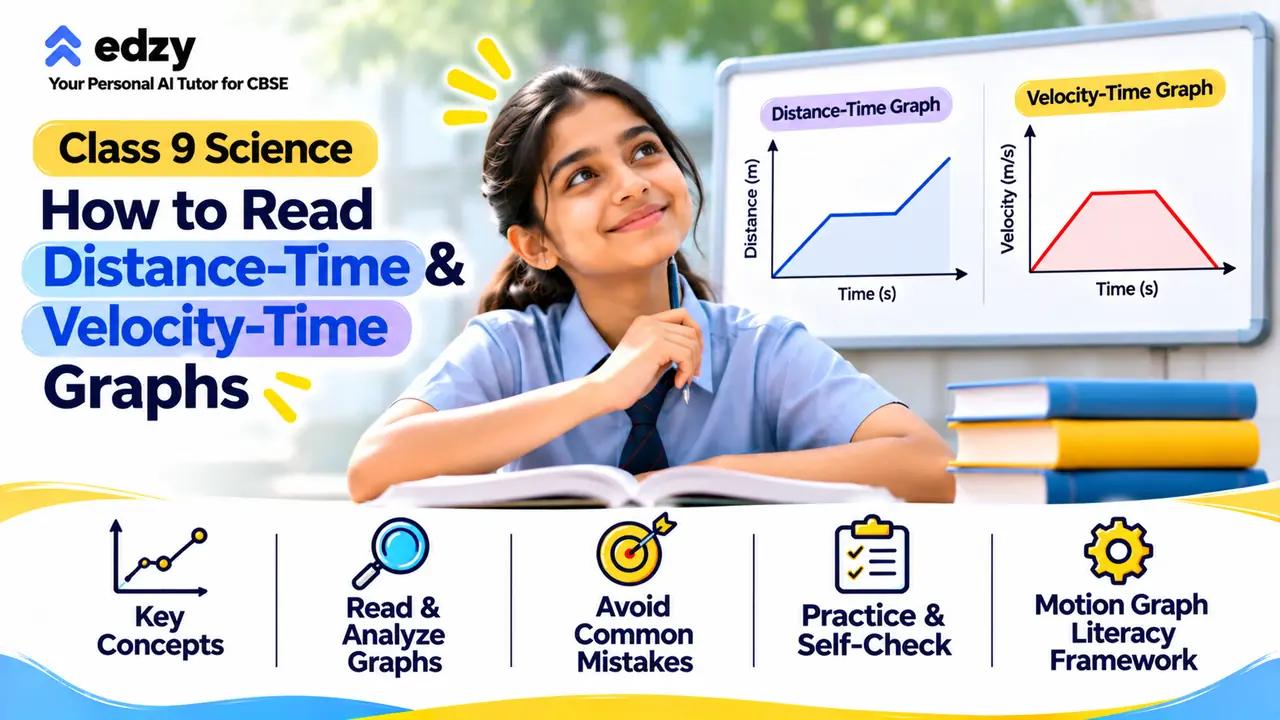
Distance-time graphs and velocity-time graphs are fundamental tools in physics that depict the relationship between distance traveled and time taken. A distance-time graph plots distance on the vertical axis (y-axis) and time on the horizontal axis (x-axis). The slope of the line in a distance-time graph represents speed. A steeper slope indicates a higher speed, while a horizontal line indicates that the object is at rest.
In contrast, a velocity-time graph represents velocity on the vertical axis and time on the horizontal axis. The slope of the line in a velocity-time graph indicates acceleration. A positive slope shows an increase in velocity, while a negative slope indicates deceleration. Understanding these graphs is crucial for solving problems related to motion, especially in the context of the CBSE syllabus.
For example, if a Class 9 student is studying Chapter 8: Motion, they may encounter a problem where they need to determine the speed of a moving car based on its distance-time graph. By analyzing the slope of the graph, they can calculate the speed and apply this knowledge to various real-world scenarios. To further enhance your understanding, you can explore our guide on improving speed in exams.
Worked Example: Analyzing a Distance-Time Graph
Let’s consider a practical example to illustrate how to read a distance-time graph. Imagine a graph where a cyclist travels 20 meters in 5 seconds, then remains stationary for 10 seconds, and finally travels another 30 meters in 10 seconds. The graph would consist of three distinct segments:
1. **First Segment (0 to 5 seconds)**: The cyclist moves from 0 to 20 meters. The slope of this segment is calculated as follows:
Slope = (Change in Distance) / (Change in Time) = (20 m - 0 m) / (5 s - 0 s) = 4 m/s.
2. **Second Segment (5 to 15 seconds)**: The cyclist is stationary, so the distance remains at 20 meters. This segment is a horizontal line, indicating zero speed.
3. **Third Segment (15 to 25 seconds)**: The cyclist moves from 20 meters to 50 meters in 10 seconds. The slope is:
Slope = (50 m - 20 m) / (25 s - 15 s) = 3 m/s.
By interpreting this graph, students can identify the cyclist's speed during different intervals and understand the concept of acceleration and deceleration.
Common Misconceptions and Corrections
One common misconception among students is confusing distance with displacement. While distance is a scalar quantity that refers to how much ground an object has covered, displacement is a vector quantity that considers the shortest path from the initial to the final position. This distinction is crucial when interpreting graphs.
Another frequent error is misreading the slope of the graph. Students often assume that a flat line indicates movement, while it actually signifies that the object is stationary. For instance, in the example of the cyclist, the horizontal line during the second segment indicates that the cyclist is not moving, which is a critical point to grasp.
To correct these misconceptions, students should practice analyzing various graphs and discussing their interpretations with peers or teachers. Engaging in group discussions can clarify doubts and reinforce understanding. Additionally, students can benefit from our article on avoiding last-minute cramming and learn how to study smarter, not longer.
Independent Practice and Self-Check
To solidify your understanding of distance-time and velocity-time graphs, it is essential to engage in independent practice. Here are a few exercises that can help:
1. **Create Your Own Graphs**: Take a real-life scenario, such as a walk in the park, and plot a distance-time graph based on your movements. Identify the segments where you were walking, standing still, or running.
2. **Analyze Sample Graphs**: Use sample distance-time graphs from your NCERT textbook or online resources. Answer questions related to speed, distance, and time based on the graphs.
3. **Peer Teaching**: Explain the concepts of distance-time and velocity-time graphs to a classmate. Teaching others reinforces your understanding and helps identify any gaps in your knowledge.
4. **Practice Past Papers**: Review past CBSE exam papers focusing on motion graphs. This practice will familiarize you with the types of questions asked and improve your confidence. For further guidance on exam preparation, consider reading about how to use past year papers effectively.
Why Do CBSE Students Struggle with Motion Graphs?
Why do CBSE students struggle with motion graphs? Many students find motion graphs challenging due to a lack of practice and understanding of the underlying concepts. The graphical representation of motion requires not just memorization but also the ability to interpret slopes and areas accurately. Without adequate practice, students may misinterpret the information conveyed by the graphs, leading to errors in exams.
The Motion Graph Literacy Framework
To aid students in mastering distance-time and velocity-time graphs, we introduce the Motion Graph Literacy Framework. This framework emphasizes three key components: Understanding, Application, and Reflection.
1. **Understanding**: Students must first grasp the fundamental concepts of distance, displacement, speed, and velocity. This foundational knowledge is essential for interpreting graphs accurately.
2. **Application**: Once students understand the concepts, they should apply this knowledge to real-world scenarios and practice problems. Engaging with various graph types will enhance their analytical skills.
3. **Reflection**: After practicing, students should reflect on their learning. This can involve discussing mistakes made during practice or explaining concepts to peers. Reflection solidifies understanding and prepares students for exams.
By utilizing the Motion Graph Literacy Framework, students can develop a comprehensive understanding of motion graphs, leading to improved performance in CBSE examinations. For additional strategies on exam preparation, check out our blog on planning your final month before board exams.
Conclusion: Mastering Motion Graphs for Success
Mastering distance-time and velocity-time graphs is a crucial skill for Class 9 students studying motion. By understanding the core concepts, practicing effectively, and utilizing the Motion Graph Literacy Framework, students can overcome common challenges and excel in their examinations. Every mark a CBSE student loses to a careless error is a mark they already earned — the only task left is making sure it shows up on the paper.
Suggested blogs

Class 11 Physics: How to Draw Free-Body Diagrams Correctly
Mastering Free-Body Diagrams: A Key Skill for CBSE Physics Success.

Class 10 Science: How to Understand Magnetic Effects of Electric Current
Mastering the magnetic effects of electric current is crucial for Class 10 students — here’s how to do it effectively.

Class 10 Maths: How to Choose Between Substitution and Elimination
Mastering the art of solving linear equations with confidence and clarity.

Class 9 Maths: How to Understand Polynomials With Worked Examples
Mastering polynomials is crucial for Class 9 students to excel in mathematics and beyond.